Research on Physical Properties of Soil
Adiel (Leader), Joe, Thuta, Thea, Isabella
School of Science and Technology, Singapore
School of Science and Technology, Singapore
_______________________________________________________
Section 1 - Abstract
1.1 - Abstract
Soil makes up a thin layer of the earth. It has the capability to support plants, which provide people with food, fibre and forest products. As soil is located at the boundary between the atmosphere and the land, it determines the amount of rain that enters the soil. It then stores and purifies the water. Hence, soil is essential to both the production of food and the environment. In order to convert this area to a village, knowledge about the ground that we’re going to build it on - the soil -is needed. Soil has both physical and chemical properties, both of which will affect the success of building the village. In this report, the focus will be on the physical properties.
Section 2 - Introduction
2.1 - Research Questions
Based on its physical properties, what type of soil is located around the Tanjong Leman vicinity? The different types of soil are sand, clay and silt.
Based on its physical properties, what type of soil is located around the Tanjong Leman vicinity? The different types of soil are sand, clay and silt.
2.2 - Hypothesis
The soil in the Tanjong Leman vicinity is mostly sandy as the region is coastal and coastal areas usually have sandy soil.
Section 3 - Methods
3.1 Equipment List
- Soil Floccuating Reagent (60ml)
- Texture Dispersing Reagent (60ml)
- Soil Texture Sand
- Test Tubes x3, Soil Textures (50ml each) with caps
- Plastic Pipets x2 (1ml) with caps
- A Study of Soil Science booklet
3.2 Diagrams of Experimental Setup
(in the folder)
3.3 Procedures
1. Label the Soil Texture Tubes A, B and C and place them in the rack.
2. Add the soil sample to Soil Texture Tube A until it is even with line 25. Gently tap the tube to eliminate air spaces.
3. Use the pipet to add 1ml of Texture Dispersing Reagent to the sample in Soil Texture Tube A. Add tap water to line 45.
4. Cap it and gently shake test tube A till the soil sample and water are thoroughly mixed.
5. Place Soil Texture Tube A in the rack and let it stand undisturbed for exactly 30 seconds.
6. Carefully pour off all the solution into Soil Texture Tube B then return Tube A to the rack. Let Tube B stand undisturbed for 30 minutes.
7. Carefully pour off the solution from Soil Texture Tube B into Soil Texture Tube C then return Tube B to the rack.
8. Add 1ml of Soil Flocculation Reagent to Soil Texture Tube C. Cap and gently shake for one minute.
9. Place Soil Texture Tube C in the rack and allow to stand until all the clay in the suspension settles, which may require up to 24h.
10. Read Soil Texture Tube A at top of soil level. Divide reading by 15 and multiply by 100 to calculate percentage sand in the soil.
11. Read Soil Texture Tube B at top of soil level. Divide reading by 15 and multiply by 100 to calculate percentage of silt in the soil.
12. Take the initial volume (15) and subtract the percentages of Tubes A and B to calculate volume of clay. Divide the value by 15 and multiply by 100 to calculate the percentage of clay in the soil.
13. Repeat from step 1 for each sample.
13. Repeat from step 1 for each sample.
14. Sandy soil is soil material that contains 85% or more sand where the percentage of silt plus 1.5 time the percentage of clay shall not exceed 15. Silt soil is described as soil material that contains 80% or more silt and less than 12% clay. Clay soil is described as soil material that contains 40% or more clay and less than 45% sand and less than 40% silt.
3.4 Risk Assessment and Management

3.5 Data Analysis
By measuring the ratio of the 3 elements of soil types, the soil type is determined using the soil triangle diagram.
Section 4 - Results
The results of our experiment are as shown below (Figure 4.1)

Figure 4.1

Figure 4.2 - Soil Texture Triangle
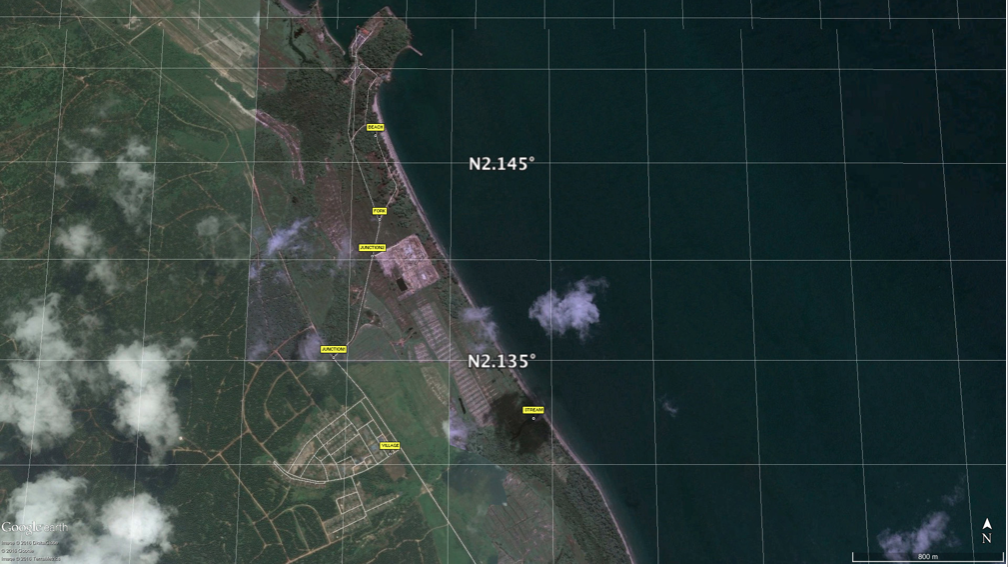
From our research, the sample from the stream is 60% sand, 13% silt and 27% clay. Hence, the soil in the stream area is sandy loam. The sample from the village is 73% sand, 13% silt, 13% clay. This shows that the soil is sandy loam. The soil in the jetty area is 60% sand, 20% silt and 20% clay. Therefore, the soil in the area is medium loam.
Section 5 - Discussion
5.1 - Key Findings & Analysis of results
The soil in the Tanjong Leman area is mostly composed of sand. The soil near the stream however is a combination of silt and sand.
5.2 - Explanation of key findings
The results mainly show the soil composites are of sand and a bit of silt. This is likely due to the samples being taken from higher ground in areas near coastal areas. Coastal areas usually have an abundance of sand.
5.3 - Evaluation of Hypothesis
The hypothesis, that the soil within Tanjong Leman, is mainly composed of sand, is correct.
5.4 - Areas for improvement
Precision could be improved when taking the soil samples, such as how much soil taken and how deep the shovel was dug into the ground to take the soil. Time management could be improved as there was insufficient time when gathering data.
Section 6 - Conclusions
6.1 - Conclusion
The Tanjong Leman area is not very practical for building or agriculture. Sand is not very stable for buildings and is also not very good at retaining water, so plants would not be able to grow well unless they have fertilisers.
6.2 - Practical Applications
With this knowledge on how to find out different kinds of sand, a piece of land can be developed more properly. There are many different kinds of uses for different types of sands. For example, sandy loam and medium loam sands are suitable to have a small range of agriculture harvest such as coconuts. In Tanjung Leman, coconuts are abundant, thus, the husks are often used in other types of agriculture such as growing melons.
6.3 - Areas for further study
In order to convert Tanjong Leman into a village, is it possible to change the type of soil in an area?
Section 7 - References
Foth, H.D. (August 2011) “A Study of Soil”
No comments:
Post a Comment